When processing GIS data, we sometimes need to analyze object movement on the map. For example, given some data records of bicycle riders lending and returning bikes (aka OD data), a shortest path (SP) algorithm is then required to find out the possible route for each rider. SP algorithm has been implemented many times by different graph libraries, say igraph and NetworkX. We needn’t to reinvent the wheel. A small but non-trivial gap is conversion from shapefile vectors to graph formats that could be read by other graph libraries.
In R language, the conversion has been covered by Binbin Lu’s shp2graph (also his talk on UseR!). I used to perform the conversion with this tool. But it comes to be frustrating in one of my recent road traffic analysis project. Two reasons: one is a lack of flexible control of road point sampling when simplifying the line vector. The other is a language gap when most of my data analysis projects are written in Python. These two basic disadvantages make potential problems when I dive into following processes of data mining. The python-s2g library then was on the road.
Piggyback on the efficiency of shapely, it is a fluent procedure to manipulate line and point data. I didn’t try to fix the error of shapefile. So a basic assumption is that two continuous lines should only be connected at ends of them, in spite of some distance tolerance (thanks to shapely’s buffer processing). s2g reads a shapefile of lines or a list of lines, and finally returns a fully connected graph (in networkx Graph). Within the procedures, a largest self-connected component is processed while all component statistics is notified.
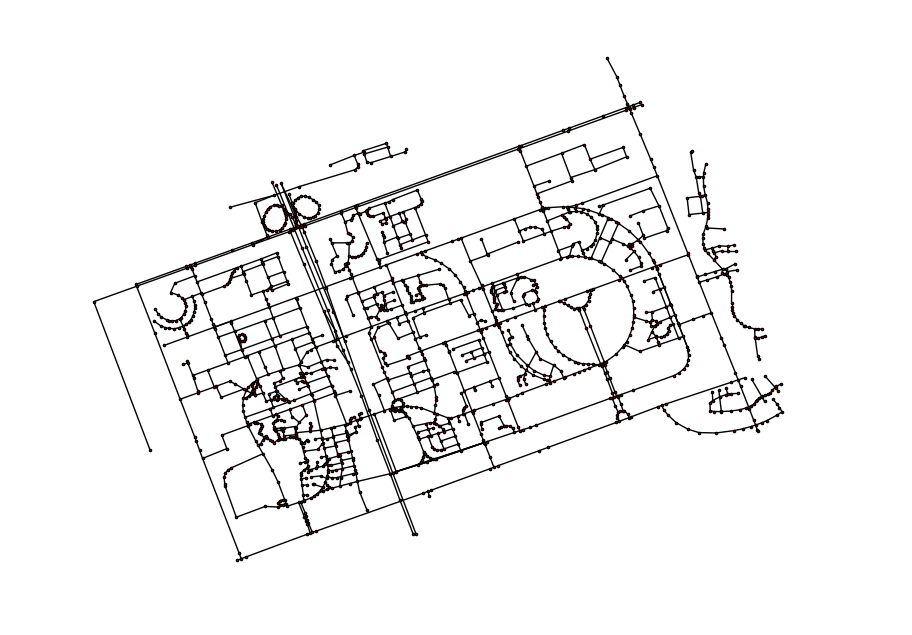
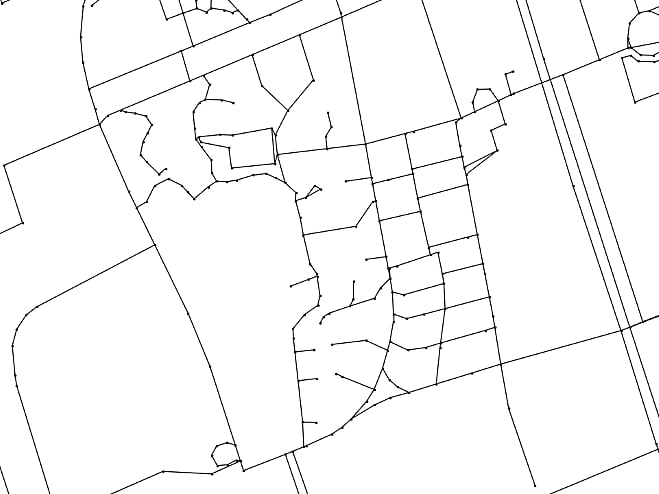
Here is a small example in tests of python-s2g. Here the map is the campus where I pursued my PhD. The shapefile was downloaded from OpenStreetMap using bbbike.org. A spatial resolution of 0.01 (km) was chosen to give a high-resolution graph mapping, which means an edge in the generated graph takes a great circle distance of 10 meters. Below is the runtime info and visualization of final graph. For more information, visit project home of s2g.
1
2
3
4
5
6
7
8
9
10
11
$ python tests/test.py
INFO:root:Validating pair-wise line connections of raw shapefiles (total 407 lines)
100% (82621 of 82621) |#################################| Elapsed Time: 0:02:28 Time: 0:02:28
Major components statistics:
        Total components: 2
        Component size: max 400, median 201.0, min 2, average 201.0
        Top comp. sizes: 400 2
INFO:root:Processing the largest component with 400 lines
INFO:root:Cutting lines with specific resolution = 0.01 km
100% (400 of 400) |####################################| Elapsed Time: 0:00:00 Time: 0:00:00
INFO:root:Graph created with 1770 nodes, 1528 edges